Most charts describe Iran's own markets and institutions, including books, cinema, games, music, media, tourism and handicrafts. Charts on other countries are marked “Global”.
Figures come from Iranian ministries, industry bodies and platforms, often published only in Persian. Every chart names its source.
Iranian years run from March to March, so 1404 is shown as 1404 (2025/26). Amounts stay in rials or tomans, and one toman equals ten rials.
Industry map
Industries are ordered by volume of content, and the shade of each tile reflects the number of items in that industry.
Featured chart
Chart page →Number of standard hotels in Iran, 1395–1400 (2016–2022)
This chart has 5 series. “1-star” went from 370 in 1395 (2016/17) to 340 in 1400 (2021/22). “2-star” went from 348 in 1395 (2016/17) to 414 in 1400 (2021/22). “3-star” went from 294 in 1395 (2016/17) to 412 in 1400 (2021/22).
All 1,210 chartsLatest charts
See all →Selected analysis
See all →Namafar publications
See all →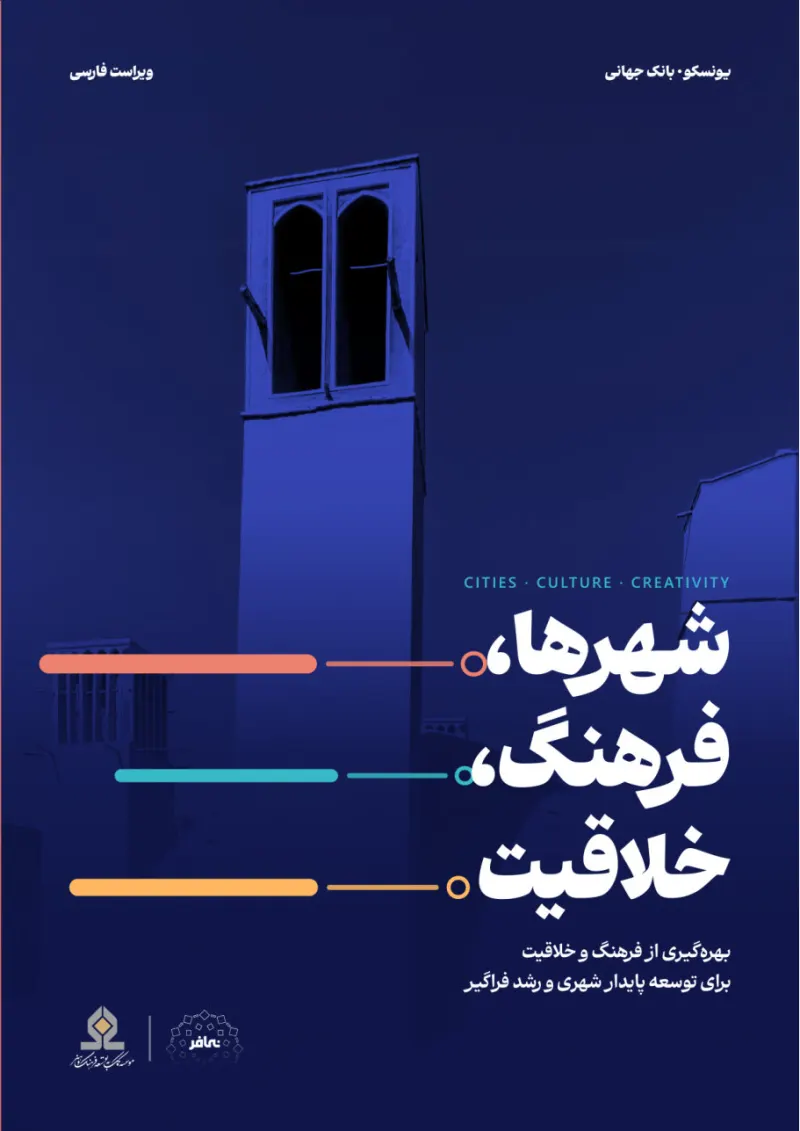 Cities, Culture, Creativity: Leveraging culture and creativity for sustainable urban development and inclusive growthCities, Culture, Creativity: Leveraging culture and creativity for sustainable urban development and inclusive growth
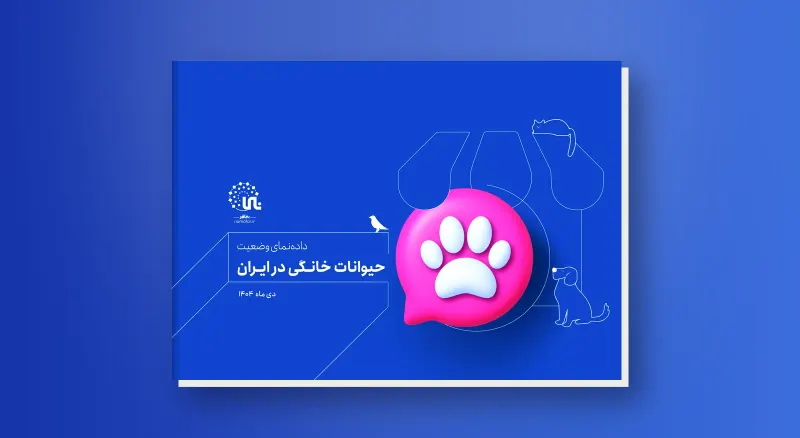 Data brief on the status of pets in IranData brief on the status of pets in Iran
Reference reports
See all → Reference reportGlobalEssential Facts About the U.S. Video Game Industry 2026 (ESA)Entertainment Software Association (ESA)2026/2723 pages
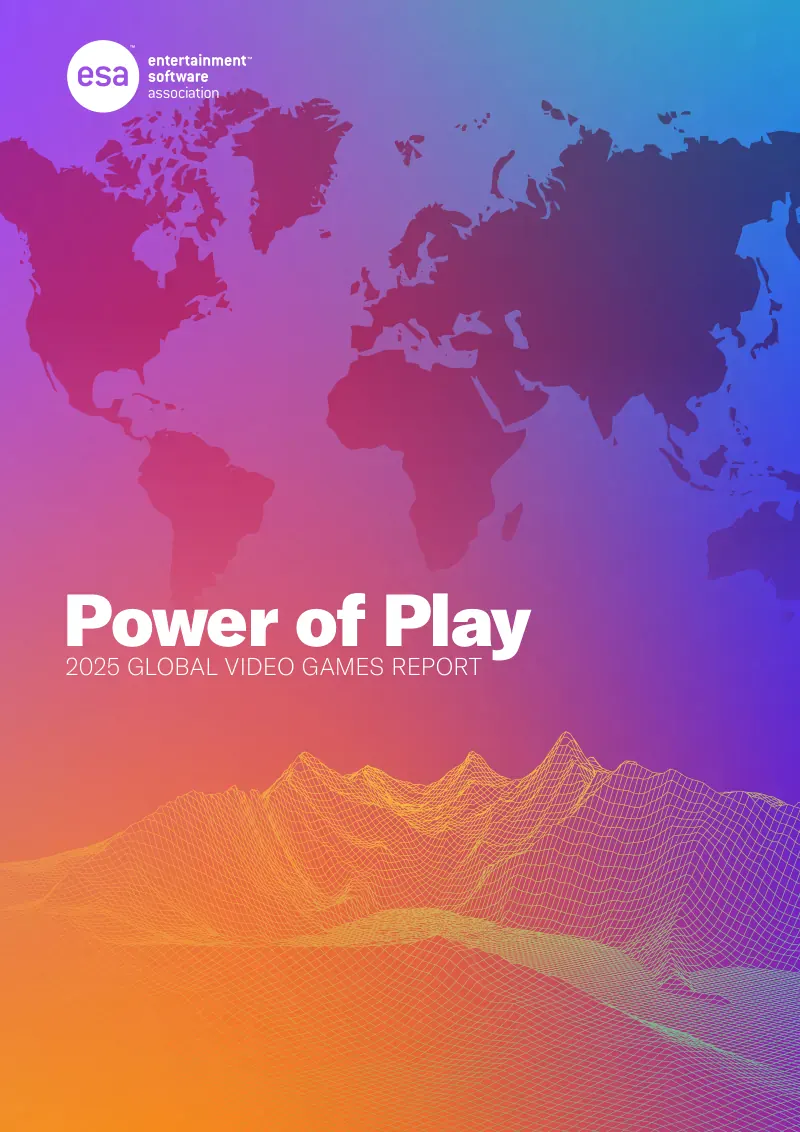 Reference reportGlobalPower of Play: global video game report 2025Entertainment Software Association (ESA)2025/2633 pages
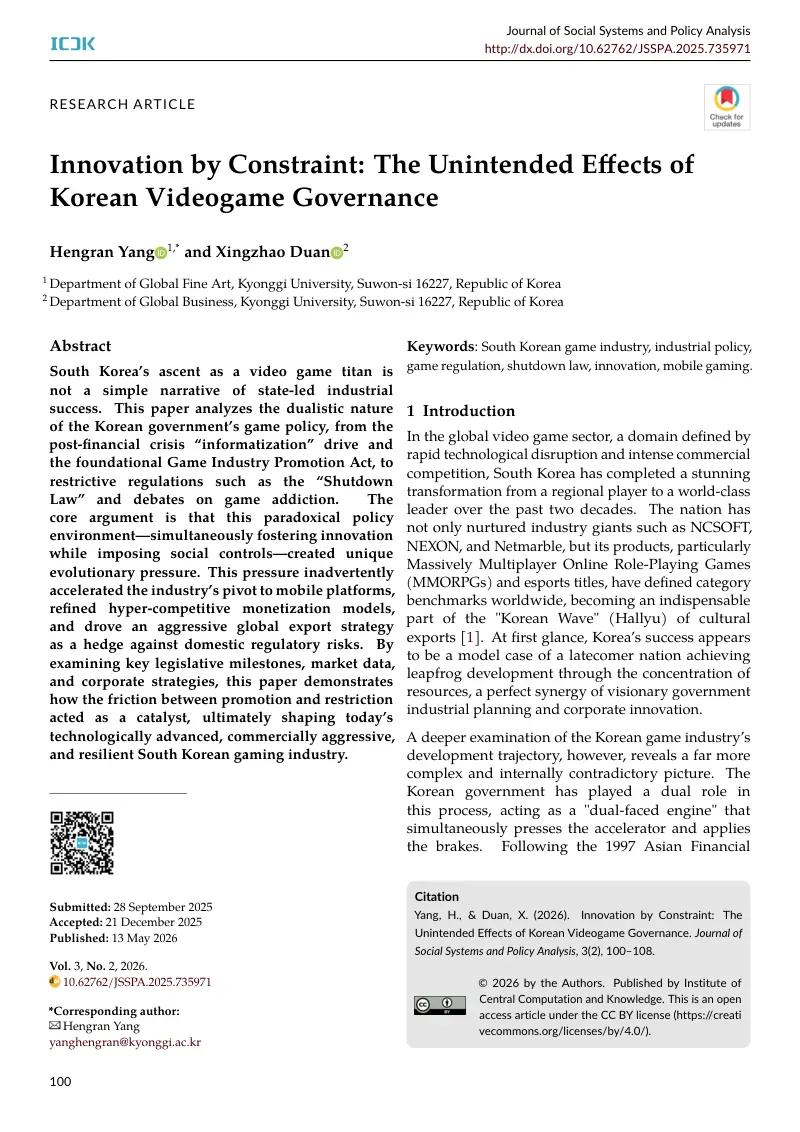 Reference reportGlobalInnovation by constraint: the unintended effects of video game governance in South KoreaJournal of Social Systems and Policy Analysis2026/279 pages
 Reference reportGlobalMobile gaming survey in Japan 2026, Cross MarketingCross Marketing2026/2738 pages
Need newer data or a custom report?
Charts after 1400 (2021/22), dashboards and custom research are available on request.