About News and media
Registered media outlets, news consumption and trust in the media, and the shift of audiences and advertising from newspapers and television to online media and messaging apps.
Namafar has published 58 charts, 6 analyses, 3 publications, 11 reports, and 23 infographics on News and media. The charts in this section were published between 2022/23 and 2024/25. Main sources: Culture and Art Statistical Yearbook 1401 (2022/23), Namafar, HateLab, Semrush, and BCW.
Most-read analysis on News and media
- Comparing traditional and digital advertising
- Assessing IRIB's performance compared with BBC and Al Jazeera
- Social assessment of VOD: Twitter users' topics and sentiment on Iran's home video network
- Global Digital Report 2023
- The impact of artificial intelligence on the advertising industry
- The TikTok revolution: how TikTok changed social media
Charts on News and media
See all →
On request
GlobalAverage distribution of advertising spending worldwide, 2018–2022
News and media2024/25Brands Vietnam; GroupM
On request
GlobalGlobal share of time spent on audio advertising in 2022, by format
News and media2024/25Edison Research; Westwood One
On request
GlobalSony advertising spending, FY 2013–2022 (billion Japanese yen/billion US dollars)
News and media2024/25Sony
On request
GlobalNumber of TVs shipped worldwide from 2015 to 2022 (in million units)
News and media2023/24TrendForce; WitsView
On request
IranNumber of foreign media representative offices in Iran: 1381–1401 (2002–2023)
News and media2023/24Culture and Art Statistical Yearbook 1401 (2022/23)
On request
IranRegistered mobile and smart media software in Iran, 1395–1401 (2016–2023)
News and media2023/24Culture and Art Statistical Yearbook 1401 (2022/23)
On request
IranNumber of offline electronic media in Iran by field of publication: 1395–1401 (2016–2023)
News and media2023/24Culture and Art Statistical Yearbook 1401 (2022/23)
On request
IranNumber of online electronic media in Iran by type, 1390–1401 (2011–2023)
News and media2023/24Culture and Art Statistical Yearbook 1401 (2022/23)
Analysis on News and media
IranSocial assessment of VOD: Twitter users' topics and sentiment on Iran's home video network
News and media2024/25
GlobalThe TikTok revolution: how TikTok changed social media
News and media2023/24
Iran and the worldAssessing IRIB's performance compared with BBC and Al Jazeera
News and media2023/24
GlobalThe impact of artificial intelligence on the advertising industry
News and media2023/24
GlobalGlobal Digital Report 2023
News and media2023/24
GlobalComparing traditional and digital advertising
News and media2023/24
Namafar publications on News and media
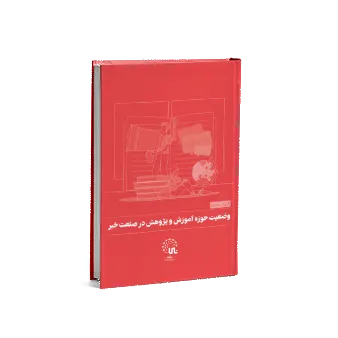
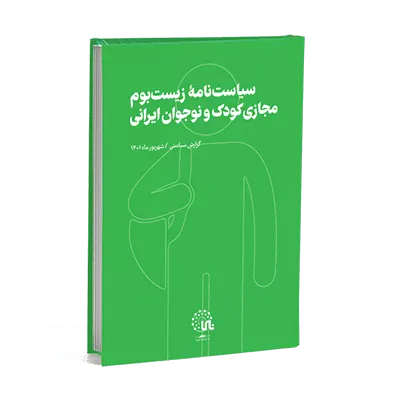
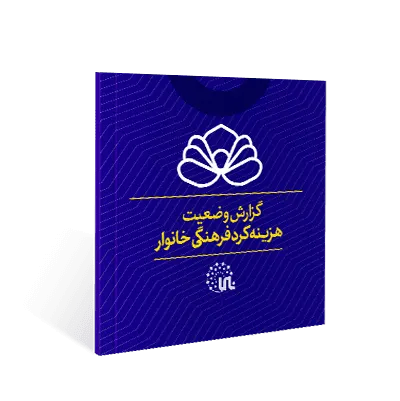
Reference reports on News and media
See all →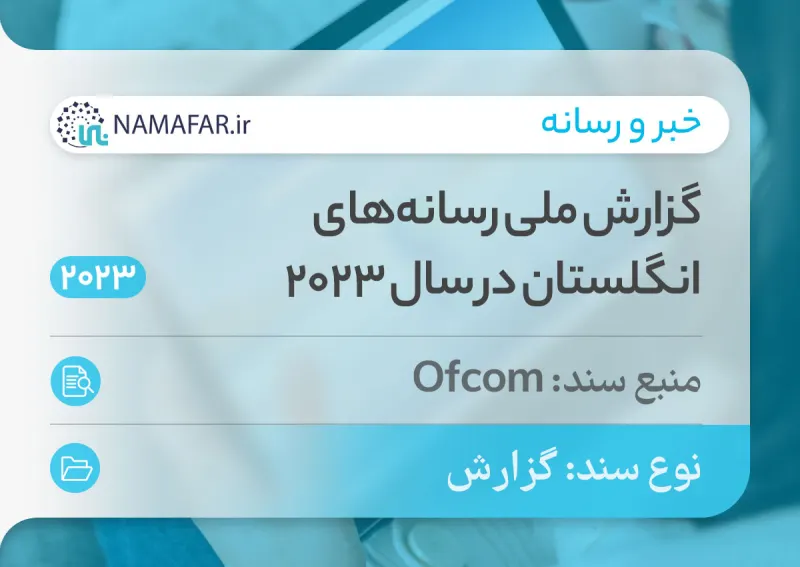 Reference reportGlobalUK national media report, 2023Ofcom2023/2472 pages
 Reference reportGlobalSocial networks in organizations2022/2327 pages
 Reference reportGlobalGlobal digital overview report, 2021hootsuite2022/23299 pages
 Reference reportGlobalThe world's top brandsInterbrand2022/2325 pages
 Reference reportIranStatistical yearbook of culture, sports, and tourism in IranStatistical Centre of Iran2019/2035 pages
 Reference reportIranIRIB (Islamic Republic of Iran Broadcasting) yearbookGeneral Directorate of Statistics and Information Technology Development2020/21456 pages
Infographics on News and media
See all →
IranInstagram's economic media in Iran
News and media2026/27Instagram
IranAnalysis sells on Instagram in Iran
News and media2026/27Instagram
IranMahfel's shine on Persian YouTube
News and media2025/26YouTube
Global6.4 billion dollars in costs imposed on Israel
News and media2025/26
Iran and the worldPleading for a ceasefire: widespread Zionist support for a ceasefire in the Iran–Israel war
News and media2025/26
GlobalButcher of hospitals! Deadly statistics on the Zionist regime's attacks on hospitals
News and media2025/26
IranAmerica's bunker-buster bomb: was it effective against Natanz and Fordow?
News and media2025/26
Iran and the worldThe Strait of Hormuz: pulse of the world energy market
News and media2025/26